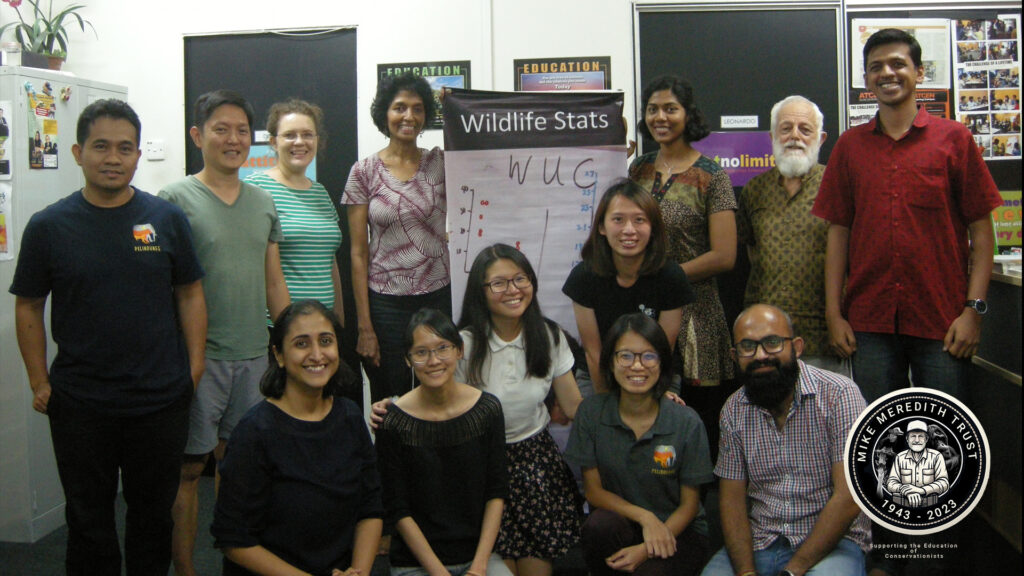
The raw data entered in a spreadsheet will always need checking and likely reformatting before it can be used in R or other statistical software. Some of this is best done with spreadsheet tools, some can be done in R. We spent the first two days working with participants own data sets to get them into a suitable state. Then we looked at plotting functions available in base R and ways to adjust them to make plots more informative as well as more attractive. In the final session, participants produced plots for their own data.
Instructor team: Ngumbang, Chee Pheng and Mike.

